
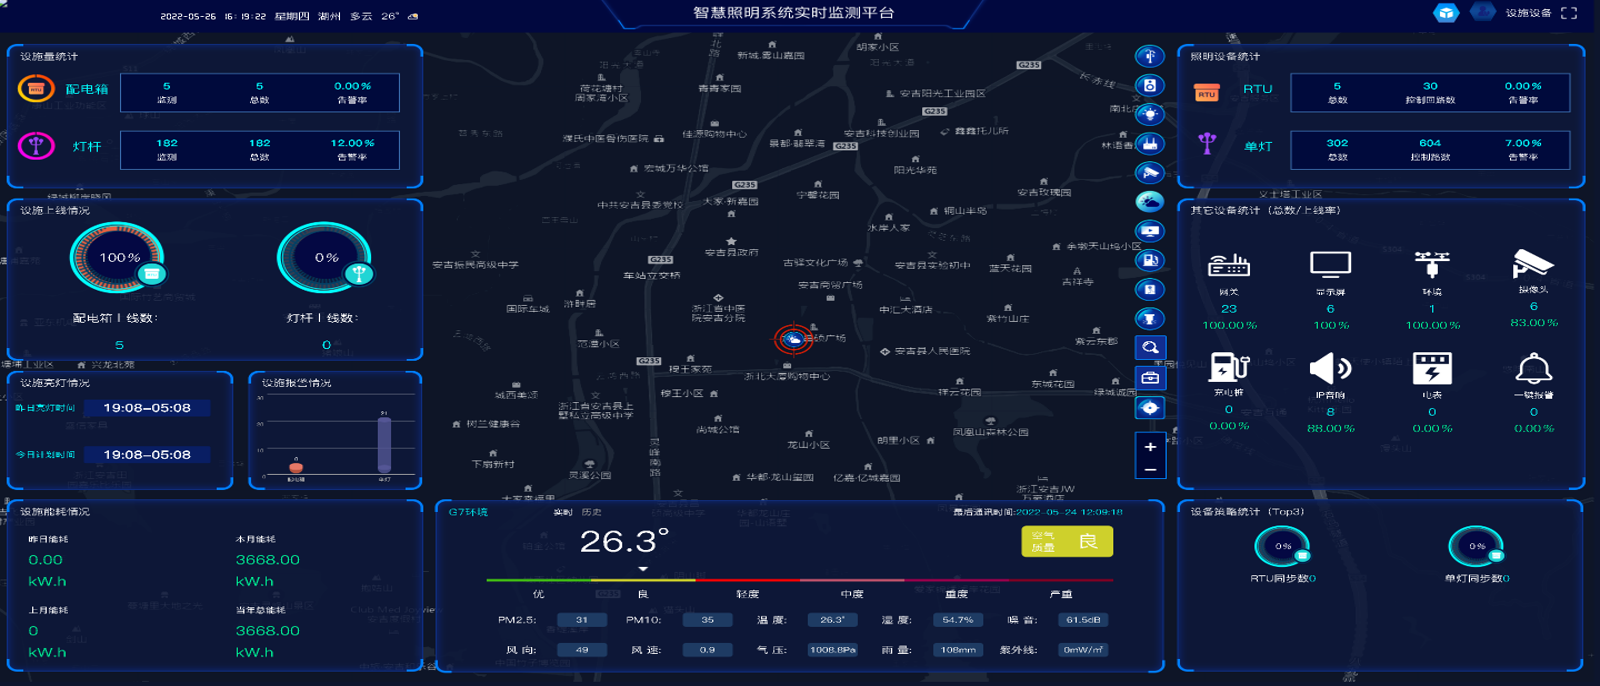

Full-dimensional visualization for quick response & efficient operation: Presents multi-dimensional data in an intuitive visual style like equipment status, energy consumption, fault alarms, etc. enabling a clear overview of operation status and fast grasp of the system’s overall situation. Monitoring devices anomalies in real-time, provides early warning for faults. Facilitates rapid maintenance and improves management efficiency. Integrates geographic information system, light and smart sensors data, providing support for smart lighting and empowering intelligent decision.
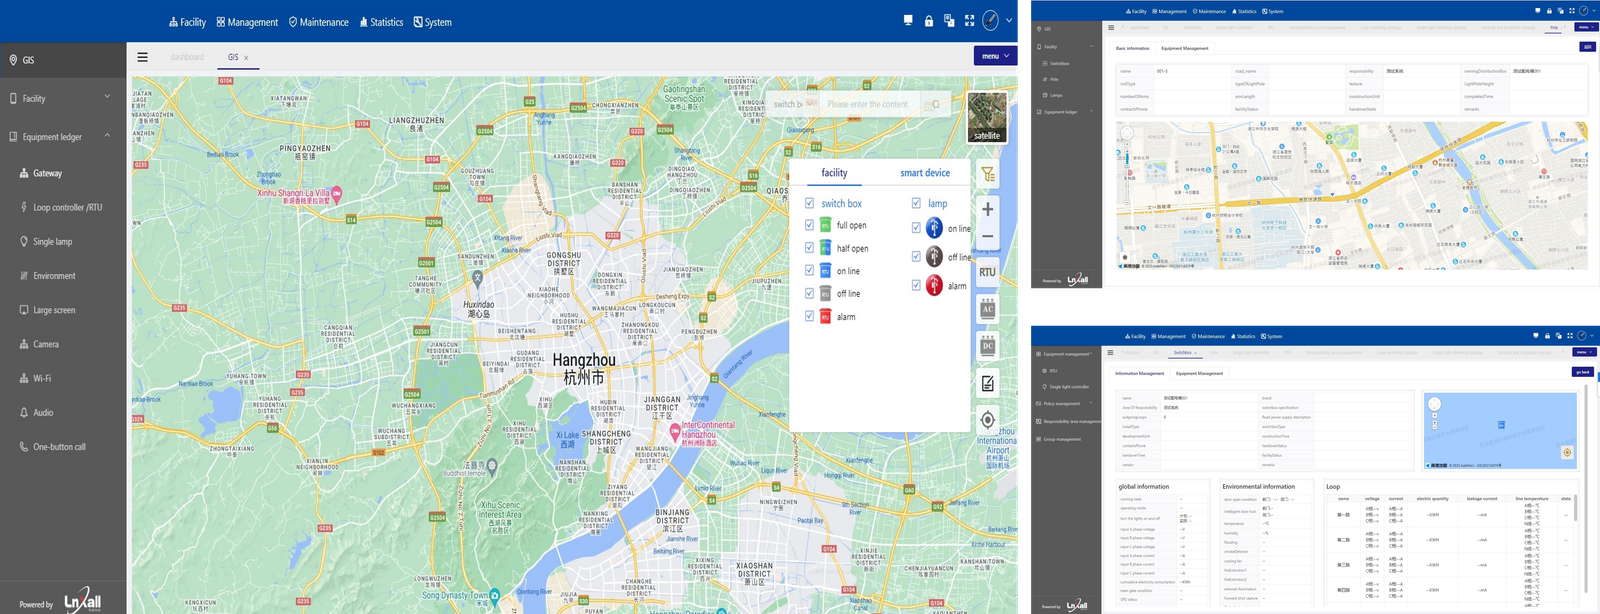
Google map-based GIS system creates a visualized operation for user
The user-friendly interface provides an intuitive & visualized interaction to system operator, which can display the distribution of all facilities under the project like feeder pillars, street lights, and lampposts on the map. Support device position dragging and map zooming operations, quickly locate devices, and get an overview of the area status. Check real-time status (open, closed, alarm, etc.) of facilities (like lights, power cabinets). Link with detailed asset information of infrastructure like lampposts, distribution cabinets, lamps, etc. Facilitate full-life cycle management of facilities, and improve the asset data section.
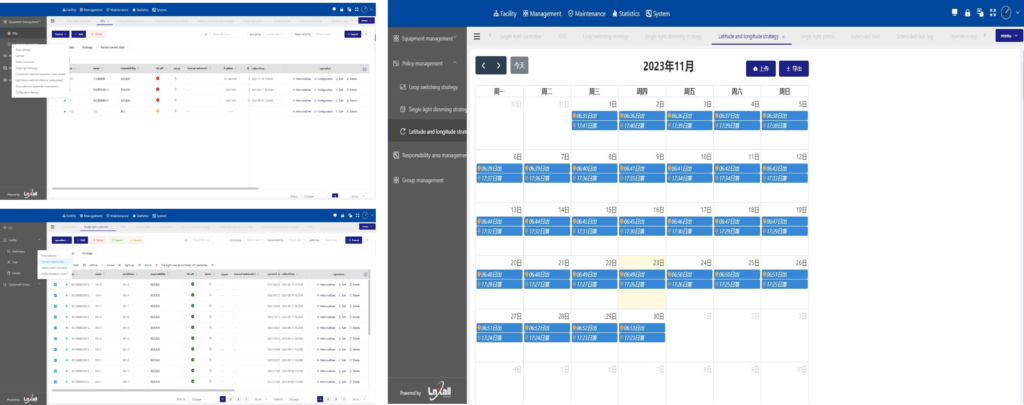
Light schedules and real-time individual & group control
Calendar-based lighting task schedules combining with longitude & latitude control enables creating smart lighting schedules. For instance, set distinct lighting programs for workdays and holidays to meet vary time – specific lighting demands, combined with local site longitude & latitude data that relates to sunrise / sunset times, to control luminaires brightness levels. Flexible control by individual or group facilitates different management of lights in diverse scenarios (e.g., main roads, parks), and caters to personalized lighting needs.
Alarm management along with handling procedure
The failure reporting system enables fault fast localization, improving the speed of response and solve issues, and process tracking. Contrast with traditional work order, it transforms costly reactive maintenance into efficient proactive maintenance, which saves the time and costs associated with manual repair, enhancing management precision and efficiency.
Once mal-function occurrence, the system will locate the fault devices on the map in real time.
Trigger alarm notifications, The registered operator will pick up faults message via SMS or Email.
Ticketing will be generated after verifying the alarm details. Then Dispatch work orders, the task will be assigned to responsible personnel.
Execute work order, the technicians carry out repair operations in accordance with work order specifications.
Fault recovery and alarm clearance.
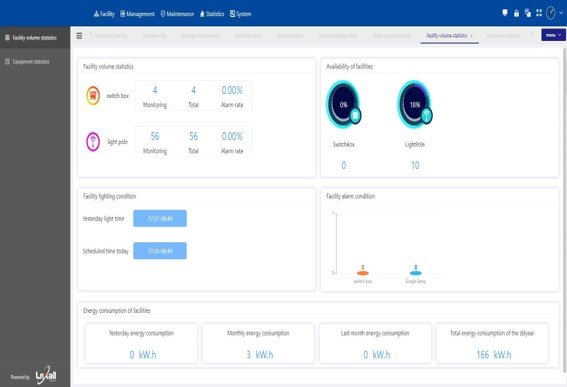
Data analysis and statistics
With robust capabilities of data acquisition, storage and processing, the system plays a role in optimizing the efficiency and performance of urban lighting infrastructure. The analytical tools enable streetlight manager to derive actionable insights from massive amounts of information, support decision-making. By analyzing real-time and historical data, the system can detect, identify, and predict potential faults.
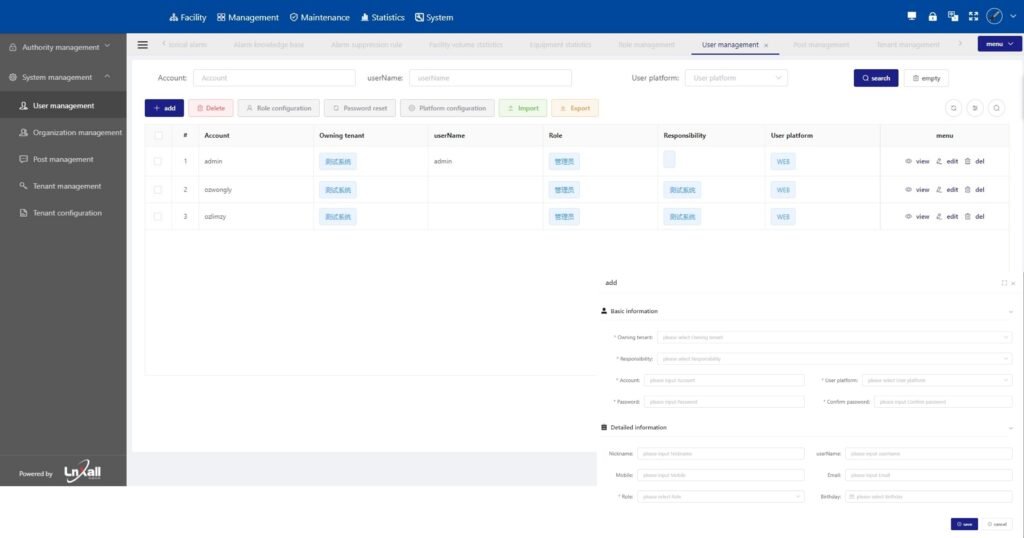
System management
The system offers comprehensive authentication and permission systems, ensuring secure access and role- based controls for different Stakeholders. Meantime, A complementary mobile app to help the field crew during device installation and commissioning. Helps field crew geolocate devices correctly to resolve issues.